
Report and log
Performance report
Section titled “Performance report”Trading → Performance Report menu (opens in its own window).
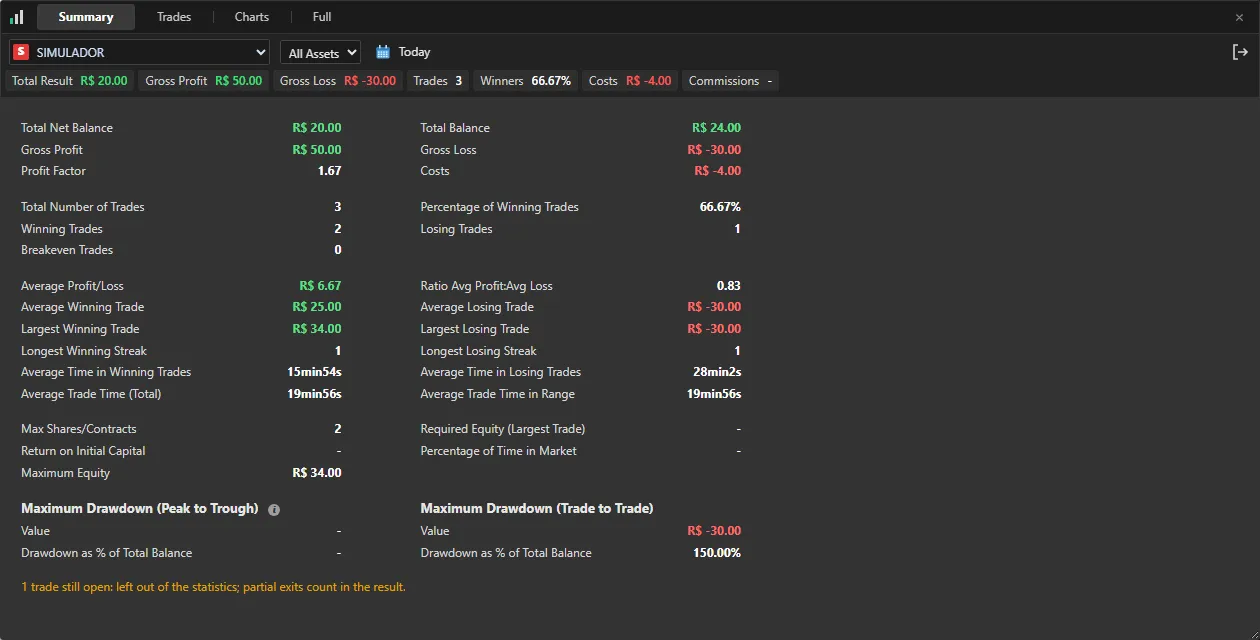 App screenshot with fictitious data (demo).
- Tabs: Summary (balance, gross profit and loss, profit factor, averages, streaks, times and maximum drawdown), Trades (table with open, close, time, B/S quantity, prices, TET, averaged and results in money and points; click a column title to sort), Charts (Equity, Trades, Efficiency, Assets, by time of day and by Category, in the bottom tabs) and Full (table and charts together).
- Account (SIMULADOR, REAL, Automations, Wallets, Replay) and asset on the top bar.
- Calendar: Today, Yesterday (previous business day), Weekly (since Monday), 30 Days, Monthly, 3 Months, Quarterly, 6 Months, Semester, the current year, Year (12 months) and Custom, where you pick the start and end dates.
- The totals strip shows Total Result, Gross Profit, Gross Loss, Trades, Winners and Costs. MT5 reports brokerage and fees together, so Commissions shows “-” (they are in Costs).
- The icon on the right exports the trades to CSV (Latin-1,
;-separated), the same format as the Backtest.
Execution log (LIVE account)
Section titled “Execution log (LIVE account)”With REAL execution enabled in the backend, the Trading menu gets the Execution log item (opens in its own window): everything TMChart asked the
broker for (send, check, cancellations, OCO, automations, F12/panic), with time, asset, action, quantity, price, state,
retcode (green = accepted, red = refused), latency and the response or refusal reason. Filter by day,
asset and type (sent, refusals and blocks, errors and drops); click a row to see the full record. Today refreshes
by itself every 5 s. It is read only: the file is logs/execucao-YYYY-MM-DD.jsonl in the TMChart data folder. The
SIMULATOR does not write to this log.