
Charts, drawings and indicators
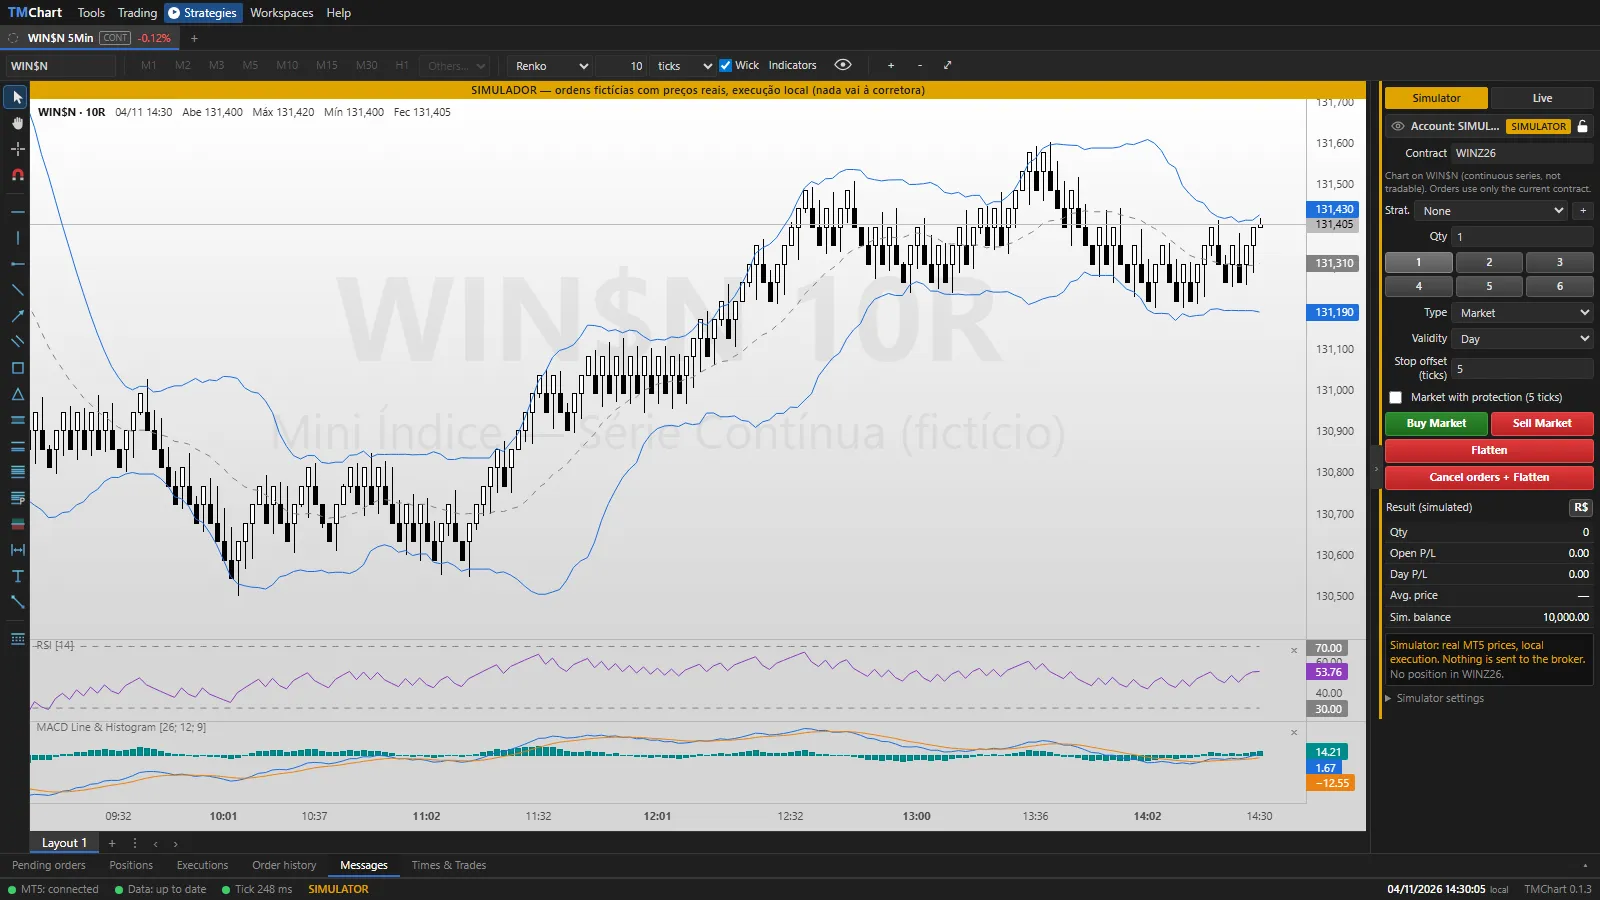 App screenshot with fictitious data (demo).
Timeframe
Section titled “Timeframe”The bar buttons (M1, M2, M3, M5, M10, M15, M30, H1) change the timeframe; Others… brings the other MT5 timeframes (up to monthly). Fit chart goes back to the last candle with the default zoom; the mouse wheel zooms in and out.
Chart types
Section titled “Chart types”Pick from the list next to the timeframes:
| Type | How it is built |
|---|---|
| Candlestick | Candles of the timeframe |
| Heikin Ashi | Smoothed candles; follows the timeframe |
| Renko | Bricks of N price levels (NR), with optional Wick (on by default); size in ticks or by ATR(14) |
| Range | Bars with a fixed range (in ticks) |
| Points | Box of N ticks (2P = 2 ticks); closes when it touches the level |
| N trades | One bar every N trades |
- Renko, Range, Points and N trades do not use the timeframe (the timeframe buttons are disabled). They are built from the trades of the current and the previous session; older history comes from M1, with a warning (less faithful). N trades stops where the trades end.
- The size is saved per symbol. The axis shows the real time of each bar and drawings stay anchored in time.
- Chart indicators are computed on the displayed bars. Automations, backtest and the order ticket keep using the real candles.
- Replay works with every type.
Studies (left bar)
Section titled “Studies (left bar)”Arrow (drag to measure), hand (drag the chart, F6), crosshair, horizontal line, vertical line, trend line, rectangle, region marker, support and resistance, Fibonacci retracement and projection, channel, triangle, measurement, Risk/Reward, text, arrow, horizontal ray and time ruler. The magnet snaps the click to the candle high/low.
- Click the tool and then the chart (two points; Fibonacci projection, channel and triangle ask for the third).
- Double-click a drawing to open its settings (color, style, width, Fibonacci levels, text and font).
- Edit drawing and Delete drawing are on the same bar. Drawings are saved.
- On a horizontal or trend line you can create an alert (see Alarms).
Indicators
Section titled “Indicators”Indicators button on the bar: pick from the list and Insert (in the price pane or in a new pane below). Double-click the indicator (in the Indicators window or on the chart) to open its properties. Besides averages, bands, RSI, MACD, stochastic, volume and the others, there are:
- Volume at Price, Aggression balance and Footprint: see Order flow and Super DOM.
- Tops and Bottoms Detector: marks the pivots (T/B) and joins them with lines. A pivot only appears after the bars that confirm it and the drawing changes with every new bar (it repaints); not for strategies.
- Your own NTSL and MQL5 indicators: see NTSL and MQL5.
- Exclusive (paid plan): a group at the end of the list, on the indicators and colorings tabs, with indicators and colorings made by the TMChart team. They arrive with the license, no new version to install. Without the plan they show a lock (🔒) and cannot be inserted. Their code is not shown; the parameters are in Edit → Inputs.
Compare assets
Section titled “Compare assets”On the chart, open Indicators, pick Compare Asset, click Insert (on the price window) and type the code
(e.g. WDO$N over WIN$N). Up to 4 assets per chart, each with its own color.
- The lines show the % change since the first visible bar. With a comparison, the price axis switches to % (the chart’s own asset too); scrolling or zooming changes the starting bar and recalculates.
- Below the legend each asset shows its current change; × removes the comparison. Double click the line (or the item in the Indicators window) to change the asset or color. Comparisons are saved with the tab.
- The compared points appear only at times that exist on the chart (nothing is filled in). Assets with different sessions (e.g. stocks open after WIN) start at their first bar.
- It is hidden in Renko, Range, Points, N trades and replay (a notice shows). In Heikin Ashi the compared asset uses its regular candles.
Financial Volume color
Section titled “Financial Volume color”Double-click Financial Volume (in the Indicators window or on the chart bars) to open its properties with the Bar color. Default restores the original color. The color is saved with the tab.
Coloring rules on indicators and averages on indicators
Section titled “Coloring rules on indicators and averages on indicators”- Right-click on what you want to paint → Insert Coloring Rule ▸ → pick a coloring script from the library
(scripts that use
PaintBar). What is under the cursor counts: candle → candles; Financial Volume bars → volume; line of an average or indicator → that line (the indicator’s 1st line). - On an indicator the script sees the indicator value:
Close,Open,HighandLowbecome its value, soMedia(20, Close)is the average of the volume (or of the RSI etc.).Volumeis still the volume. - Remove Coloring Rule ▸ is enabled only if what is under the cursor already has a rule.
- A coloring script inserted from the Indicators window into the volume window (or another indicator’s window) also becomes a rule of that window’s indicator. Older rules already in the volume window keep painting the candles: remove and insert them again.
- Averages on indicators: in the Indicators window choose Moving Average (or Adaptive, Hull, T3) and Insert into the volume window or another indicator’s window: the average is calculated on the window’s main indicator and uses its scale. Removing the indicator also removes its averages and rules.
- Closing a window: the × in the top right corner of each window below the price (volume or indicator) removes the whole window, with its indicators, averages and rules. Windows below the price have no background of their own: the chart background continues behind them.
Prior Cote with the settlement
Section titled “Prior Cote with the settlement”MT5 does not provide the settlement price. Only on WIN and WDO: in Prior Cote, with Calculate on = Settlement, every new day the
Previous day settlement window opens: type the value (e.g. 128450 or 5432.50) and OK. The value is per
asset and valid only for that day (the line appears on today’s bars); tomorrow the window asks again. Leave
blank = the indicator is not shown today. To fix it, use Change today’s settlement… in the Prior Cote
properties. NTSL PriorCote(4) uses the same value.
Appearance
Section titled “Appearance”Settings → Appearance holds the colors of the chart, the candles and the order lines. They apply right away to all charts (open and new) and are saved; the ↺ next to a color restores its default, and Restore all colors restores them all. NTSL script coloring takes priority over the candle colors.
Background watermark (the symbol name behind the candles):
- Text size: 20% to 200% (default 100%).
- Opacity: 0% to 50% (default 5%); 0% hides the watermark.
- The ↺ restores the item’s default. Restore all colors does not change the watermark.