
Backtest and optimization
The Backtest runs an NTSL strategy (or an MQL5 EA) on the symbol’s historical candles and shows the result it would have had. It only uses historical data: no order is sent.
How to run
Section titled “How to run”- Open the Strategy Editor (Strategies menu) and select a strategy (marked strat.).
- Open the editor’s Backtest tab (or the Backtest button, which opens its own window).
- Choose the Analysis Period and the Timeframe, adjust the fields below and click Run (▶). The Timeframe also accepts Renko, Points and Seconds (number beside it, as in automations): Renko and Points are built from M1 (less accurate than trades, noted in the result); Seconds, from each session’s trades (up to 10 business days per backtest, plus the previous session for warm-up).
The backtest uses the editor’s code, even if it is not saved.
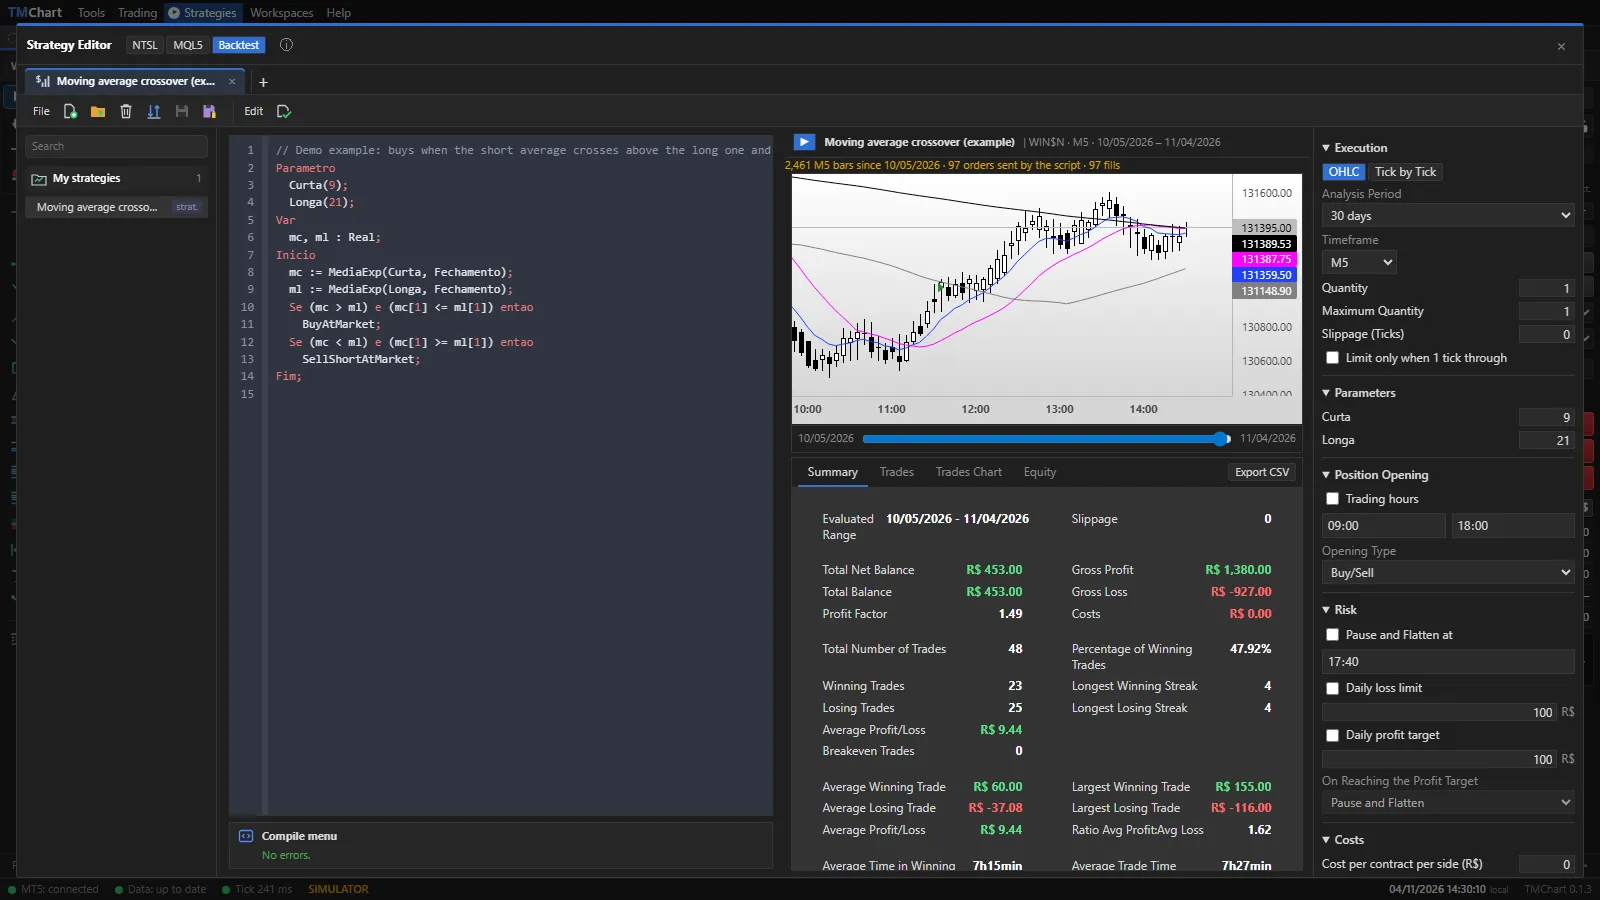 App screenshot with fictitious data (demo).
Settings
Section titled “Settings”| Group | Fields |
|---|---|
| Execution | Quantity, Maximum Quantity, Slippage (Ticks), Limit only when 1 tick through (a limit order only fills if the price goes 1 tick past it, closer to a real account) |
| Parameters | The script’s Inputs, with the default value next to them |
| Position Opening | Trading hours (outside them the script does not open or add to a position; exits still apply) and Opening Type (Buy/Sell, Buy only, Sell only) |
| Risk | Pause and Flatten at, Daily loss limit, Daily profit target (when reached: pause and flatten, or just pause) |
| Costs | Cost per contract per side; for cash stocks, the simulator’s fees |
How orders are simulated
Section titled “How orders are simulated”- OHLC mode: candles only (MT5 does not provide historical ticks).
- An order generated at a bar’s close fills on the next bar.
- Inside the bar, the price path is open → low → high → close on an up candle and open → high → low → close on a down candle.
- Net result = gross + costs.
Results
Section titled “Results”- Summary: net balance, gross profit and loss, profit factor, number of trades, % winners, streaks, averages, time in the market, maximum equity and maximum drawdown.
- Trades: each trade with entry, exit, points, gross, costs, net, duration and cumulative.
- Trades Chart: backtest entries and exits marked with the ▶ triangle at the fill price (green for buys, red for sells). Only backtest trades show here, never the account’s; they no longer show on the main chart.
- Equity: the cumulative result curve.
- Export CSV: the trades in CSV (Latin-1,
;-separated), the same format as the Performance Report.
Parameter optimization
Section titled “Parameter optimization”Open Strategies → Parameter Optimization (or the Optimize mode in the Backtest window).
- New Optimization: choose the strategy, symbols and period (General tab), the range of each parameter (Parameters tab) and the Risk and Costs rules.
- The My Optimizations list shows the progress; you can pause, resume, duplicate, rename and delete.
- In Results, compare the variations (profit factor, % winners…) and use Use these values in the script to take the chosen parameters to the Backtest.
MQL5 EA
Section titled “MQL5 EA”The backtest and optimization of an MQL5 EA are in the editor MQL5 tab (TMChart Tester, OHLC per minute modeling) and in the Backtest panel (NTSL | MQL5). You can check the result against the MetaTrader 5 Strategy Tester. See MQL5.
Purchased automations
Section titled “Purchased automations”Purchased automations (.tmauto) run in the Backtest with adjustable parameters, but without the optimizer and without
access to the code.