
Order flow and Super DOM
The order-flow tools use the trades (ticks) that your broker’s MetaTrader 5 provides, with the aggressor side.
What MT5 does not report (the buying/selling broker, for example) does not appear: TMChart does not make up data. On
the continuous series (WIN$N) the trades are those of the current contract.
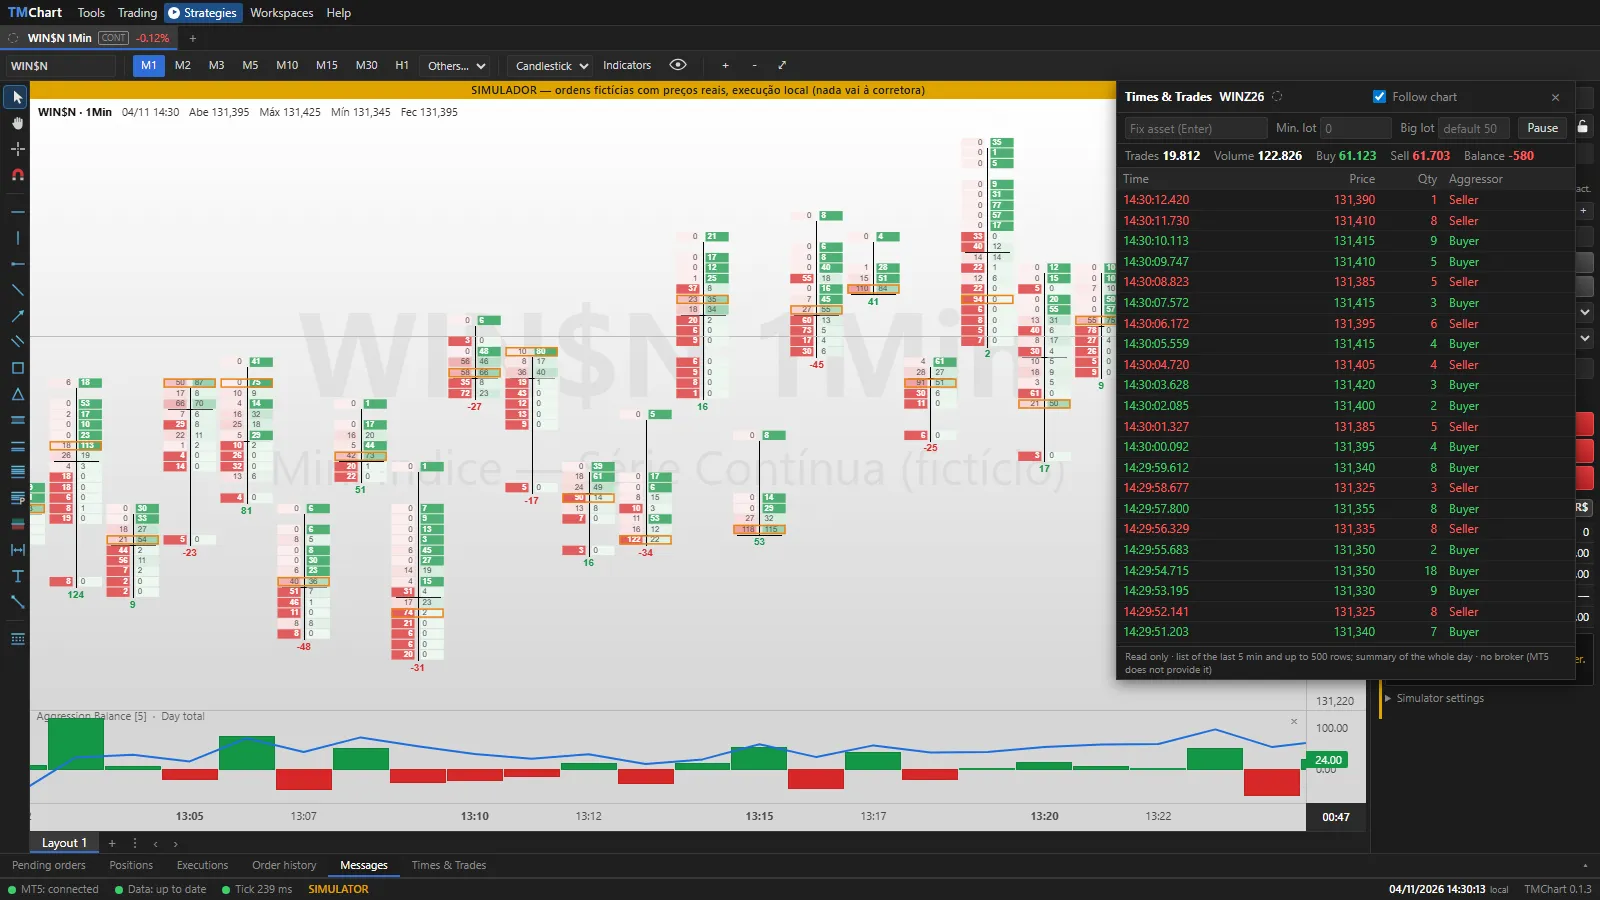 App screenshot with fictitious data (demo).
Times & Trades
Section titled “Times & Trades”Tools → Times & Trades (own window) or the Times & Trades tab of the bottom panel.
- Columns: Time (with milliseconds), Price, Qty and Aggressor (Buyer in green, Seller in red).
- It follows the active chart; Fix asset (Enter) pins a symbol and Follow chart goes back to following.
- Min. lot hides smaller trades; Big lot highlights the larger ones (default per symbol: WIN 50, WDO 10, stocks 10,000; saved per symbol). Pause freezes scrolling.
- The top sums up the whole day: trades, volume, buy, sell and the balance. The list shows the last 5 minutes (up to 500 rows). It is read-only.
Volume at Price
Section titled “Volume at Price”Volume at Price indicator (Indicators window): histogram on the right of the chart with the volume per price, split into buy (green) × sell (red), the POC (price with the most volume) highlighted and the 70% value area. Period: Day (default), Visible or N days (default 5); 1-tick grouping (editable). With no trades in the period, it uses the candle volume and warns.
Aggression balance
Section titled “Aggression balance”Aggression balance indicator in a pane below the price: histogram of each candle’s balance (buy − sell) and the line of the day’s cumulative balance (resets every session).
Footprint
Section titled “Footprint”Footprint indicator over the candle, only on M1 to M15: at each price of the candle, Sell × Buy (two numbers). Strong color = imbalance (default 300%), border = the candle POC and, below, the delta (buy − sell). 1-tick grouping, editable and saved per symbol. Zoom in on the chart to read the numbers.
Order Book
Section titled “Order Book”Tools → Order Book (own window): the buy and sell offers per price, as MT5 provides them. At the top, Book | Super DOM switches the mode (saved).
Super DOM
Section titled “Super DOM”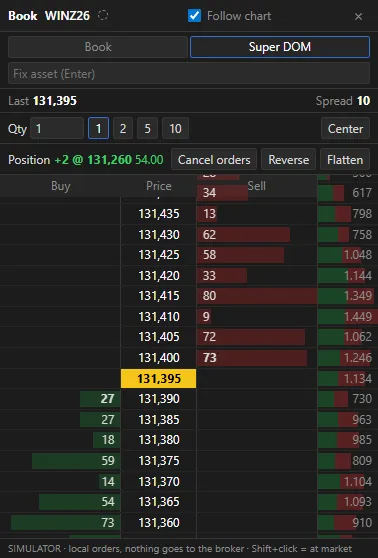 App screenshot with fictitious data (demo).
A price ladder with the Buy | Price | Sell columns, the book offers and Day vol. (volume traded today at each price: green bar = buy, red = sell). It trades the order ticket account (SIMULATOR, replay or LIVE).
- Click the Buy column: buy limit at the price (at the market or below) or stop (above). On the Sell column, the opposite. Shift + click = at market.
- Qty with quick lots (saved per symbol). Orders and the AVG (average price) show on the price row; click an order to cancel it and drag it to change the price. The position stop and target can be dragged too.
- Cancel orders, Reverse (twice the open quantity, at market) and Flatten. Center goes back to the last price; the mouse wheel scrolls the ladder.
- The trade strategies (OCO) picked in the order ticket also apply to Super DOM orders, and so does the fat-finger warning.